Don’t let your DC Participants get FAANGed
More than ever, DC plan sponsors and their advisors need to be aware of the impact the FAANG stocks are having on participant behavior. I am not always a big proponent of explaining industry acronyms to clients, but the FAANG [Facebook, Amazon, Apple, Netflix, Google] moniker grew a life of its own after CNBC host Jim Cramer coined the term in 2013. Today, these companies account for well over $4 trillion of market capitalization. Microsoft was recently added to the select grouping of big tech companies to develop, predictably, a new acronym “FANMAG.”
Let’s begin by looking at the combined composition of the FANMAG stocks found inside the commonly referenced index ETFs.
| ETF | # of Holdings | FANMAG Combined Weight as of August 6, 2020 |
|---|---|---|
| SPDR® S&P 500 ETF Trust [ticker: SPY] | 507 | 23.41% |
| iShares Russell 1000 Growth ETF [ticker: IWF] | 438 | 38.8% |
| Invesco QQQ Trust [ticker: QQQ] | 104 | 49.21% |
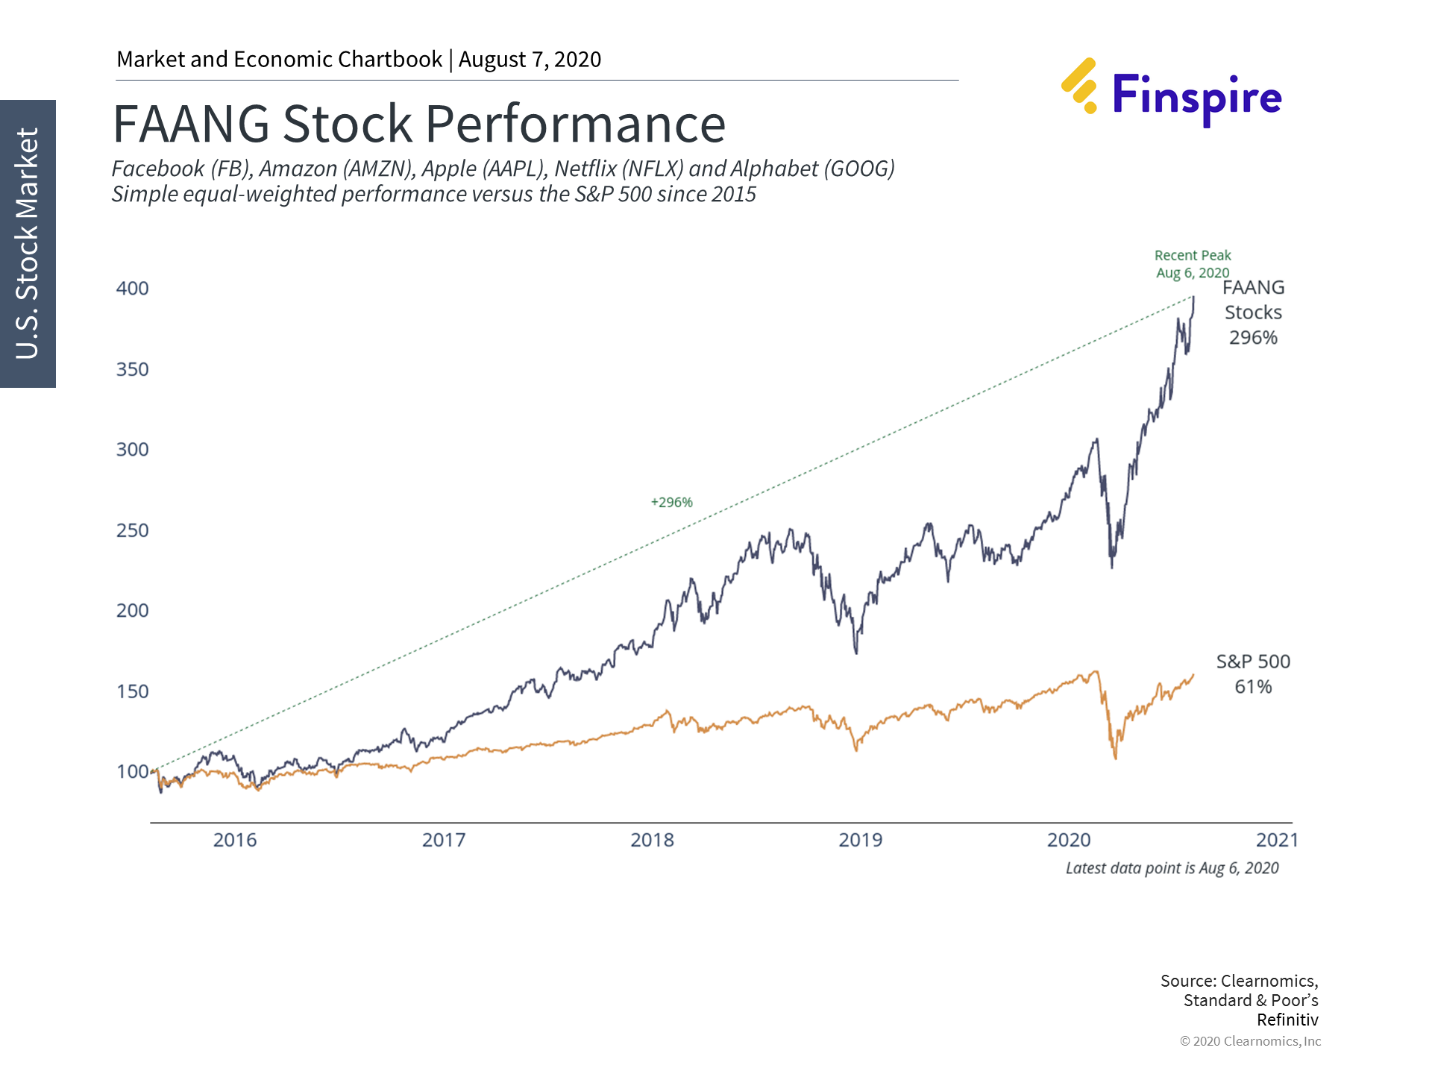
Recent performance of the FAANG stocks, relative to the broader S&P 500 are illustrated below. This illustration uses an equal weighted portfolio of the five companies relative to the S&P 500 over the last 5 years. The hypothetical returns of the equal weighted FAANG basket fetched a 296% cumulative return versus 61% for the S&P 500.

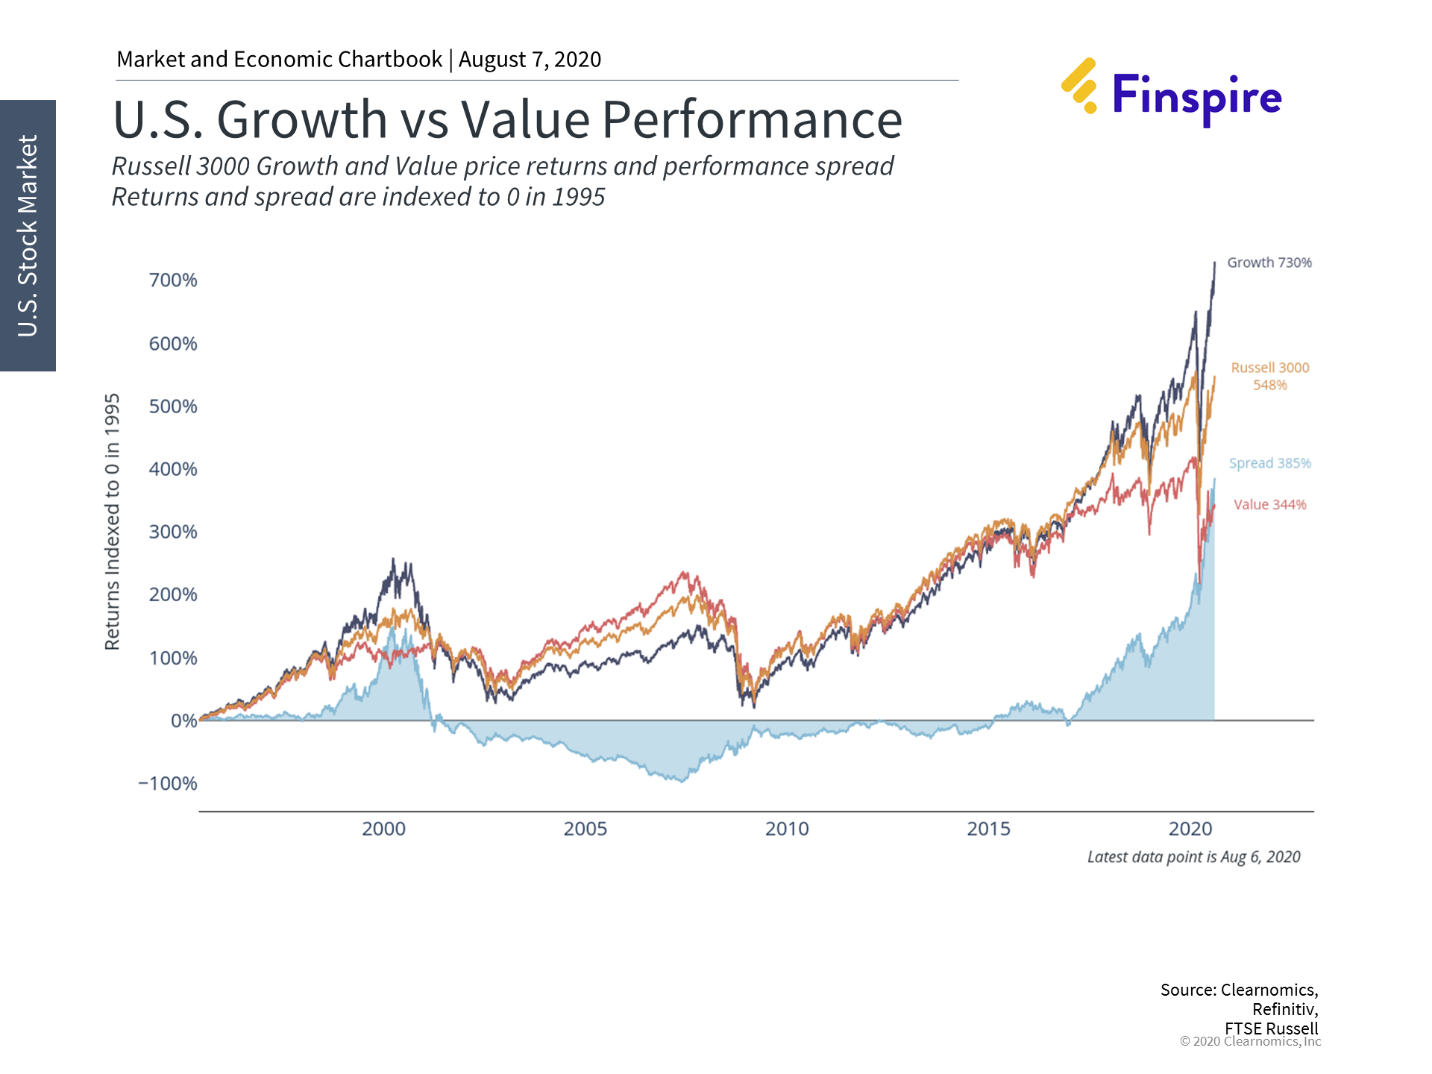
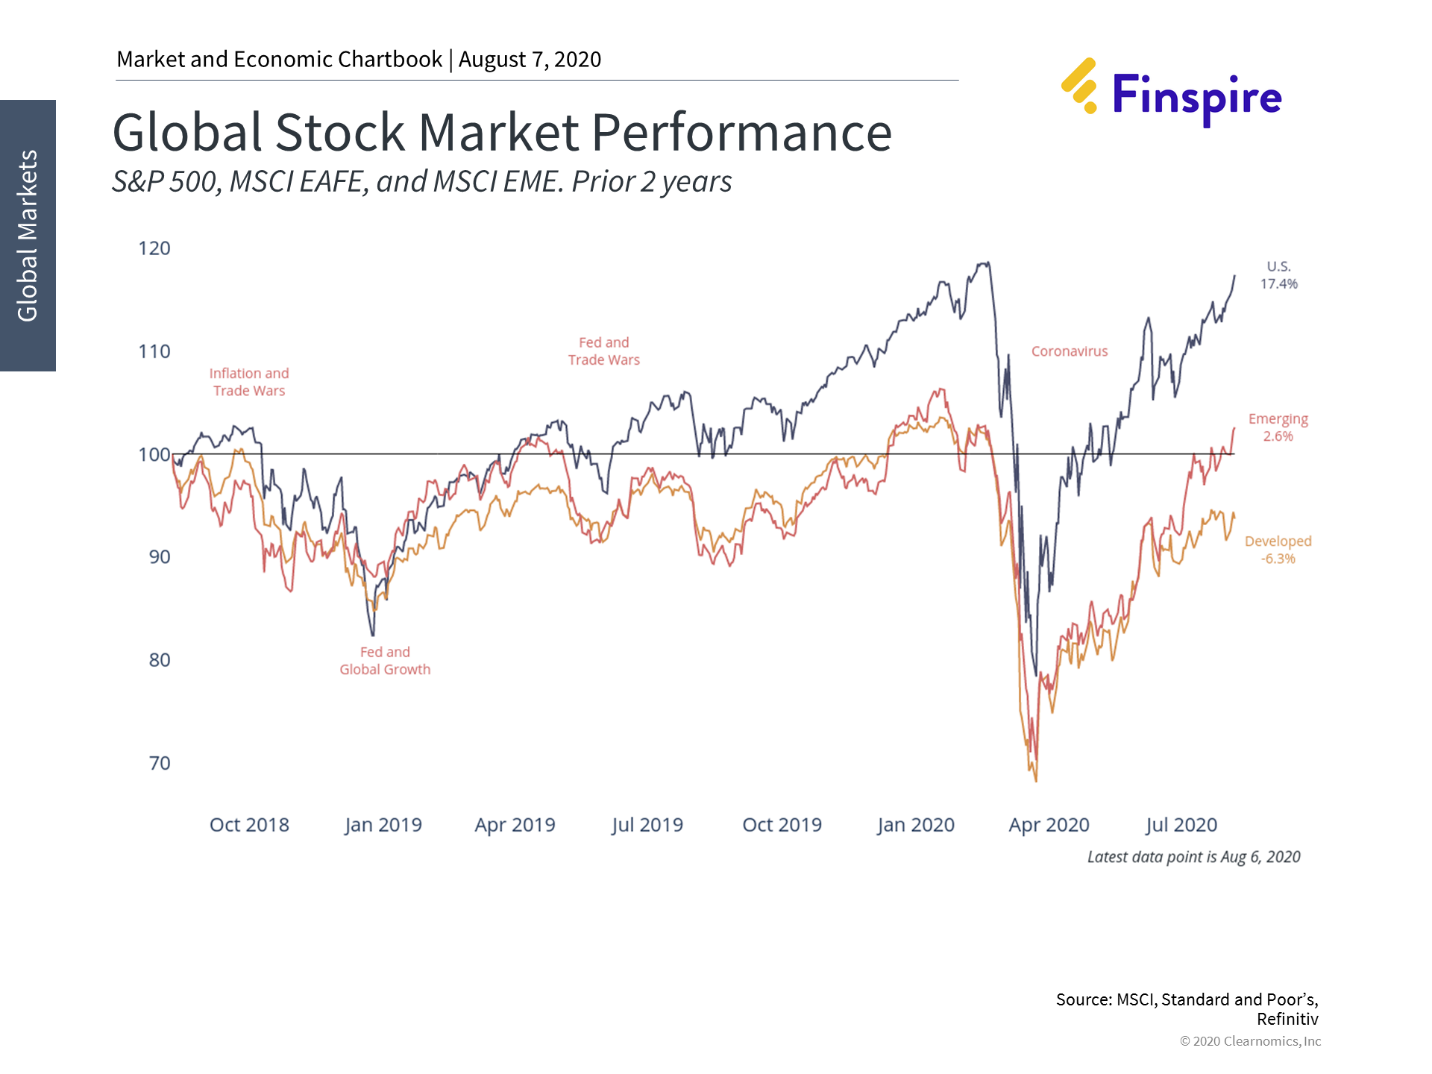
Second quarter results report a massive disparity in returns over the last 12 months ending June 30, 2020 between Growth and Value, US Large Caps and Small Caps and US versus Non-US equities.

Perhaps the most interesting aspect of comparing US Growth vs. US Value is the spread between the two is now beyond what formed during the technology “bubble” in late 1999 and early 2000.

The FAANG impact spreads beyond the Growth vs. Value assessment and right into a much larger picture of US equities relative to overseas equities. The technology sector currently accounts for over 24% of the composition of the S&P 500 yet less than 9% of the MSCI EAFE Index.
These disparities are more visible than ever and watch for a corresponding accumulated imbalance in plan assets between growth and value equities. It is only behaviorally natural for investors to follow a decade of incredible return disparity right into growth equities right at the time the spread appears to have reached historic levels. Due to the rise of the FANMAG percentage composition of commonly utilized index strategies, DC participants seeking diversification may be substantially over allocated to the technology sector.
Participant risk capacity should be assessed before implementing a proper portfolio construct. This assessment may be more important now than ever before and Plan advisors need to be on the front lines to help participants avoid getting “FAANGed” when the tide turns.
Important Disclosures
Securities offered through IFP Securities, LLC, dba Independent Financial Partners (IFP), member FINRA/SIPC. Investment advice offered through IFP Advisors, LLC, dba Independent Financial Partners (IFP), a Registered Investment Adviser. IFP and Finspire, LLC are not affiliated. The information given herein is taken from sources that IFP Advisors, LLC, dba Independent Financial Partners (“IFP”), IFP Securities LLC, dba Independent Financial Partners, and its advisors believe to be reliable, but it is not guaranteed by us as to accuracy or completeness. This is for informational purposes only and in no event should be construed as an offer to sell or solicitation of an offer to buy any securities or products. Opinions expressed are subject to change without notice and do not take into account the particular investment objectives, financial situation, or needs of individual investors. Investors cannot invest directly into an index. Past performance is no guarantee for future results. The MSCI EAFE Index is a stock market index that is designed to measure the equity market performance of developed markets outside of the U.S. & Canada. It is maintained by MSCI Inc., a provider of investment decision support tools; the EAFE acronym stands for Europe, Australasia and Far East. The MSCI Emerging Markets Index stands for Morgan Stanley Capital International (MSCI), and is an index used to measure equity market performance in global emerging markets. The MSCI Emerging Market Index captures mid and large caps across more than two dozen emerging market countries. The Russell 3000 Index is a market-capitalization-weighted equity index maintained by FTSE Russell that provides exposure to the entire U.S. stock market. The index tracks the performance of the 3,000 largest U.S.-traded stocks which represent about 98% of all U.S incorporated equity securities.
